This is the 4th of the blog posts series that talks about ARM64 performance investigation for .NET core. You can read previous blogs at:
- Part 1 - ARM64 performance of .Net Core
- Part 2 - Memory barriers in ARM64
- Part 3 - Peephole optimizations in ARM64
In this post, I will describe an important optimization opportunity that I could find while doing the performance investigation that led us to get almost 12% code size improvement.
Crossgen
For those who are not familiar with crossgen tool, let me give a brief background. When you compile your .NET code (C#/F#/VB), a binary containing MSIL (Microsoft Intermediate Language) in the form of .exe or .dll is produced. When you execute such binary, MSIL is converted to machine code by JIT compiler. The advantage of this approach is that you can port the produced binary to any OS platform or architecture i.e. you build a binary on your Windows machine and ship it to a customer running on Ubuntu. But there is a cost of JIT compiling the MSIL into machine code which becomes bottleneck for some apps that need faster startup time. Alternatively, you can precompile your binaries to generate machine code targeting a specific platform or architecture. Such binaries now contain machine code and when executed does not trigger JIT compiler immediately. Startup time for such binaries is now faster and some .NET developers prefer this approach. The code produced by crossgen have slight difference than the ones produced by JIT compiler (although RyuJIT engine is the one that produced target code in both cases). For e.g. with crossgen, in addition to having the code produced by JIT, it also includes code that make sure that during runtime, it can find the addresses of different types of method calls like delegate, direct method calls, virtual method calls, methods with generic parameters, etc.
adrp and add instructions
As mentioned in my previous blog post, the performance investigation strategy that I followed was to inspect lot of ARM64 code and compare it against x64. I did this analysis on the code that was produced by crossgen tool.
One thing that I noticed since beginning was that the code size generated for ARM64 was much bigger than that of x64. I will cover on what contributed to bigger ARM64 code size in a separate blog post. But I started investigating the benchmarks and framework library APIs whose code size is magnitude bigger on ARM64. The common pattern that was present multiple times in almost all the methods looked something like this:
1
2
3
4
5
6
        9000000B          adrp    x11, [RELOC #0x20a0e212c50]
        9100016B          add     x11, x11, #0
        90000004          adrp    x4, [RELOC #0x20a0e212c50]
        91000084          add     x4, x4, #0
        F9400084          ldr     x4, [x4]
        D63F0080          blr     x4
It was not obvious what this code is doing. ARM64 manual says that [ADRP] is a relative address from current instruction that is to be loaded in a destination register. On doing research, it turns out that .NET has its own calling covention to invoke methods during runtime. It introduces a layer called “stub” between caller and callee. Imagine “stub” as a table that containing entries to each callee. Caller jumps to the relevant entry of this “stub” table corresponding to the caller it wants to call. When binaries are compiled, the address of callee code is not known. But during runtime, when the caller invokes any method, .NET lazily evaluates the address of that method (callee code) and patch the “stub” entries with the correct address in process memory where the callee code is located. After patching, stub just forwards the calls from caller to actual method code. If you are interested in knowing more, there is a great article about stubs in .NET runtime that you can read.
.NET’s calling convention for ARM64 is that a fixed register x11 should hold an address of “indirect cell” that contains stub code. Since the range specified in adrp can only address +/-4KB page, the upper 12-bits address is encoded in this instruction. The lower bits are specified in add instruction to redirect to an indirect cell that is farther than 4KB from current instruction. Thus, the combination of adrp+add points to the final indirect cell address of the call site. That explains why the adrp+add pattern was so common and was present in almost all methods.
Redundant adrp and add instructions
In the above assembly code, you will notice that we try to load an indirect cell address 0x20a0e212c50 in x11. We again try to load same address in x4, get the indirection present at that address using ldr x4, [x4] (load the value present at address in x4 and save it in x4) and make a jump to the stub code using blr x4. If we already have the address in x11, there is no need to re-populate that address inside x4. On the contrary, if we never use the indirection from x11, we should not bother storing the cell address in x11. But as mentioned above, .NET calling convention requires the indirect cell address to be present inside x11, we cannot omit that for sure. Hence, we should remove the redundant instructions that loads the address in x4 and instead load the indirection from x11 into x4. In short, we wanted our code to like this:
1
2
3
4
        9000000B          adrp    x11, [RELOC #0x20a0e212c50]
        9100016B          add     x11, x11, #0
        F9400084          ldr     x4, [x11]
        D63F0080          blr     x4
ARM64 follows fixed encoding i.e. each instruction has fixed size of 4-bytes. If we can do the above described optimization, that would give us an improvement of 8-bytes per call site. Before I started working on it, I wrote a small utility in AnalyzeAsm to scan the ARM64 code produced for .NET Core libraries by crossgen and get an estimate of number of occurrences of such redundant adrp+add occurrences. I was surprised to see that there were around 615732 such groups in 126823 methods. That is approximately 4.9MB of code size and was worth pursuing it.
Result
With part 1 and part 2 of this work, we were able to improve the code size of .NET Core libraries by over 13.5% which was very significant.
Addressing a bug
While the benefits were great, there was also painful stretch of couple of days debugging an odd bug that got introduced by my change. There was an AccessViolation (AV) happening in ConditionalWeakTableTest test around this line. Since this was the only one test failing out of 1000+ test that we run, it was hard to believe that it has anything to do with my performance optimization work. But the failure was consistent on subsequent reruns and was only on ARM64 which made it clear that it is something to do with my changes. The challenging part was to figure out why it was crashing. For that, I had to first find out where in the machine code (and corresponding to what part of C# code) we were accessing bad memory. This involved lot of stepping through the machine code. Once I found out that, I had to do diff of the generated JIT code for the method before and after my changes to see what was different.
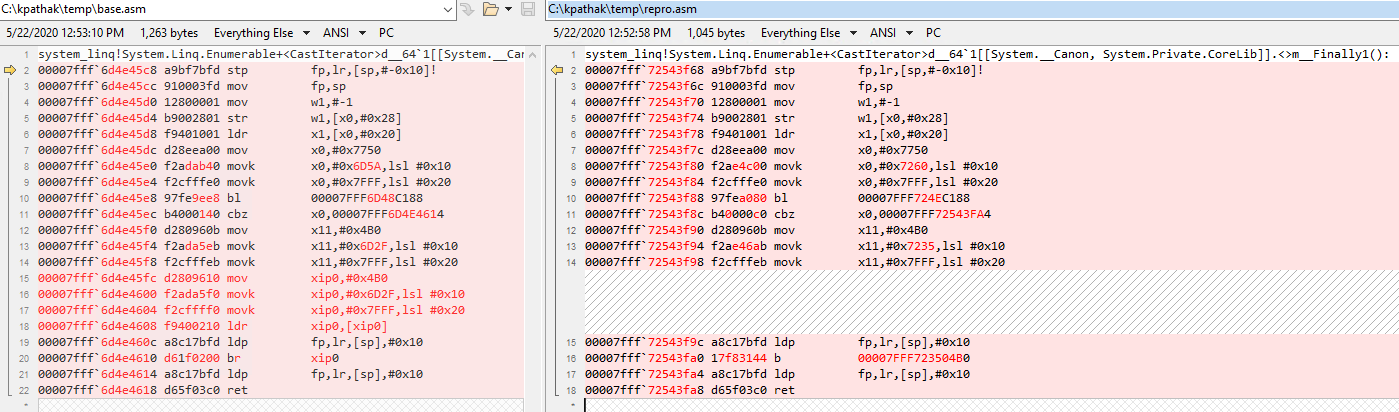
From the difference, it was clear that there was a scenario (related to tail-calls) that should not be optimized but it was still getting optimized. During JIT, before my change, we were populating the indirect cell address inside xip0 register and then jumping to it, but my change was optimizing the population of cell address inside xip0. Hence, we were jumping to an invalid memory location present inside xip0. The fix was simpler than the debugging.
Namaste!